D-MARKET Electronic Services & Trading (d/b/a “Hepsiburada”) (NASDAQ: HEPS), a leading Turkish e-commerce platform (referred to herein as “Hepsiburada” or the “Company”), today announces its unaudited financial results for the first quarter ended March 31, 2022.
First Quarter 2022 Financial and Operational Highlights
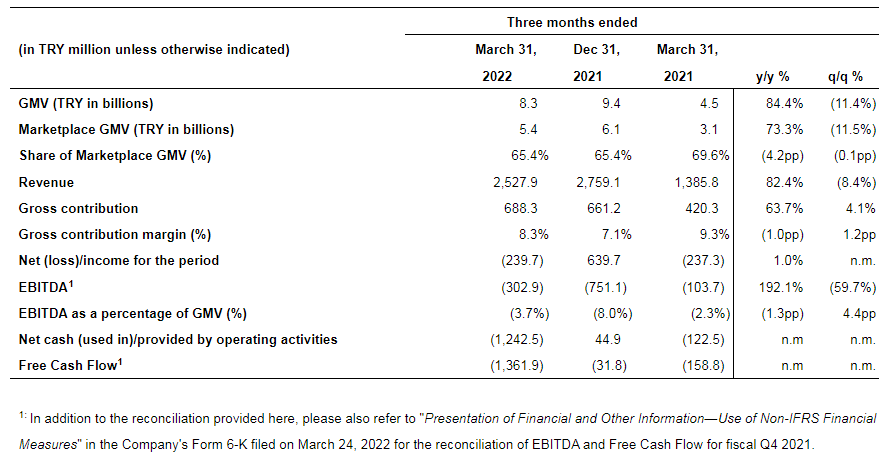
- Gross merchandise value (GMV) grew by 84.4% compared to Q1 2021, reaching TRY 8.3 billion.
- Revenue grew 82.4% compared to Q1 2021, reaching TRY 2,527.9 million.
- Number of orders increased 63.2% to 15.0 million compared to 9.2 million orders delivered in Q1 2021.
- Active Customers reached 12.0 million from 9.4 million in Q1 2021 on 27.5% increase.
- Frequency grew to 4.9 in Q1 2022 from 4.1 in Q1 2021 on 22.1% increase.
- Active Merchant base increased to 82.9 thousand from around 53.5 thousand in Q1 2021 with 55.0% increase.
- Number of SKUs reached 110.7 million as at March 31, 2022 compared to 52.6 million at March 31, 2021, marking 110% year-over-year growth.
- Share of Marketplace GMV resulted in a 65.4% level, compared to 69.6% in Q1 2021.
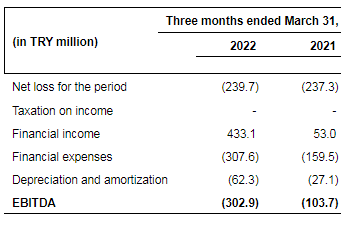
- EBITDA was negative TRY 302.9 million in Q1 2022 compared to negative TRY 103.7 million in Q1 2021.
- Net loss for the period was TRY 239.7 million compared to a net loss of TRY 237.3 million for Q1 2021.
- Free cash flow was negative TRY 1,361.9 million compared to negative TRY 158.8 million in Q1 2021.
Commenting on the results, Mr. Emirdag, CEO of Hepsiburada said: “We had a solid start to the year in the first quarter with continued growth across our key operational metrics, delivering 84% GMV growth, resulting in an 82% revenue growth compared to the same period of last year. This performance was mainly driven by 15 million orders, a rise of 63% year over year, fueled by healthy customer and order frequency growth, despite headwinds from rising inflation, fierce competition and geopolitical uncertainty.
Our household brand name, the availability of our wide product selection, our hybrid 1P-3P business model, our robust logistics network and affordability solutions contributed to this performance as we continued our focus on path to profitability with diligent execution. We continued to drive growth in strategic assets, notably Hepsipay. In just nine months since it was launched, Hepsipay Wallet surpassed 7.1 million users, or around 60% of our Active Customer base as at the end of first quarter.
We believe customer satisfaction is a critical long-term success factor for e-commerce. We are delighted to have been named Turkey’s most recommended e-commerce brand in the first quarter by FutureBright. The trust of customers encourages us to work even harder towards further improving our best-in-class customer experience, which already includes frictionless return, next-day delivery, and our convenient two-men handling cargo service, all enabled by our well-established logistics and technology infrastructure.
Meanwhile, we have progressed on our path to profitability by seeking further marketing efficiency, effective cost management and gross contribution margin improvement. Looking ahead, we are focused on continuing to build on our strong value proposition for both customers and merchants, standing by them in the current challenging macroeconomic environment. We remain committed to taking further steps forward on our path to profitability.”
Summary: Key Operational and Financial Metrics
The following table sets forth a summary of the key unaudited operating and unaudited financial data for the three months ended March 31, 2022, March 31, 2021 and December 31, 2021 prepared in accordance with IFRS.

Note that EBITDA and free cash flow are non-IFRS financial measures. See “Presentation of Financial and Other Information” section of this press release for a definition of such non-IFRS measures, a discussion of the limitations on their use, and reconciliations of the non-IFRS measures to the most directly comparable IFRS measures. See the definitions of metrics such as GMV, Marketplace GMV, share of Marketplace GMV, gross contribution, gross contribution margin, EBITDA as a percentage of GMV and number of orders and Active Customer in the “Certain Definitions” section of this press release.
Financial Outlook
The below forward-looking statements reflect Hepsiburada’s expectations as of June 1, 2022, considering trends year to date and could be subject to change, and involve inherent risks which we are not able to control or foresee. The financial outlook is based on management’s current views and estimates with respect to existing market conditions. However, there are several uncertainties including geopolitical headwinds in the region, the inflationary environment both in Turkey and global markets, local currency volatility, low consumer confidence, pressure on purchasing power, disruption risks in the supply chains, evolving competitive landscape as well as potential regulatory changes in the e-commerce law. In addition, the implementation of International Accounting Standard 29 “Financial Reporting in Hyperinflationary Economies” (“IAS 29”) to the financial statements starting from the second quarter onwards (See section “Upcoming Adjustment to the Financial Statements to Implement IAS 29 Standard”) will impact our financial statements as well as non-IFRS measures including GMV. Please refer to the Forward Looking Statements section below. Management’s views and estimates are subject to change without notice.
Our differentiated value proposition for both customers and merchants combined with our diligent execution have enabled us to make a solid start to 2022. Given the aforementioned market dynamics, the continuation of uncertainties and the limited visibility on inflation trajectory and its impact on consumer behavior for the remainder of the year, we are not making any adjustments to our guidance at this time. As a reminder, we had set our guidance at around 50% GMV growth for the full year 2022 compared to 2021 with figures unadjusted for inflation as per IAS 29.
As the improvement in our profitability margins from Q4 2021 to Q1 2022 demonstrates, we remain focused on progressing on our path to profitability through disciplined cost and cash management. Our path to profitability will continue to be derived from our accelerating growth drivers, differentiating services through robust logistics and technological capabilities, as well as prudent execution of our strategic assets. As a result, as of the end of Q1 2022, we remain committed not to raise further capital for the next 18 months.
Key Business Developments
GMV and Order Growth
At TRY 8.3 billion, our Q1 2022 GMV grew by 84.4% compared to the same period of last year when we had already experienced strong GMV growth (i.e. 94.9% GMV growth in Q1 2021 compared to Q1 2020). At a two-year compounded annual growth rate (calculated over the last 24-months period), our Q1 2022 GMV growth rate was 90%. If we were to adjust our GMV for inflation with the announced the Turkish Statistics Institute (“TurkStat”) monthly consumer price index numbers, GMV growth in Q1 2022 compared to Q1 2021 would have been 19.2%.
For Hepsiburada, GMV growth is a function of the growth in number of orders and average order value. Total number of orders in the first quarter was at 15.0 million, indicating a 63.2% increase compared to the same period of last year. As the two key components of the order growth, our Active Customer base increased to 12.0 million in Q1 2022 from 9.4 million in Q1 2021 while the (order) frequency grew to 4.9 in Q1 2022 from 4.1 in Q1 2021. Our strong order growth was instrumental in generating the GMV growth in Q1 2022. Such performance was attributable to our hybrid 1P-3P business model, strong customer value proposition including our affordability solutions, wide selection, continued product and user experience adjustments and use of data driven smart marketing tools.
In our business model, the change in average order value and the inflation trend are not fully correlated. As at the end of Q1 2022, the annual inflation as published by the TurkStat reached 61.1%, whereas our average order value rose by 13.1% in Q1 2022 compared to Q1 2021. We believe that the shift in consumer purchases towards more affordable alternatives (i.e., towards lower-priced brands, regardless of whether sales are of essentials or non-essentials); the decline in the unit sales of certain consumer electronics such as TVs, laptops, and robot vacuum cleaners; and the likelihood of having inventory purchased at lower prices (across 1P-3P) as well as competitive dynamics in the market have impacted the increase in our average order value in the first quarter of 2022.
Marketplace
In the first quarter, share of Marketplace GMV became at 65.4%, 4.2 points lower compared to the first quarter of 2021, keeping the level from the previous quarter (Q4 2021 at 65.4%). Our active merchant base increased to 82.9 thousand in Q1 2022 from 53.5 thousand in Q1 2021 a year ago, strengthening our product offering, particularly in categories such as supermarket and fashion. Our comprehensive merchant value proposition and our progress in enhancing merchant experience contributed to this strong increase in our active merchant base on our platform. Number of SKUs reached 110.7 million as at March 31, 2022 compared to 52.6 million as at March 31, 2021 with continued expansion in non-electronics and long tail products. As of March 31, 2022, the number of active SKUs through our cross-border operations on our platform has reached 2.7 million with over 1,400 participating merchants.
Our comprehensive suite of value-added services for our merchants has continued their penetration within our base. HepsiJet delivered around 53% of total Marketplace parcels in the first quarter, compared to 28% a year ago. This was possible through a distribution network of 7 fulfillment centers, 172 cross-docks and 16 transfer hubs on almost 200 thousand square meters and with of approximately 2,000 carriers. Total companies that HepsiLojistik provides fulfillment services reached 330, with the addition of 139 during the quarter. We believe having our own fulfillment services contributes to a greater customer experience while providing benefits for merchants on our marketplace. Meanwhile, over 9 thousand merchants used HepsiAd’s adtech solutions in Q1 2022, up from 6 thousand in the first quarter of 2021.
With our cross-border operations at HepsiGlobal, we aim to enable our merchants in Turkey to make cross-border sales. Using our platform, merchants from various countries (including Turkey) will be able to export their products through our convenience model. As a first step, following the pilot phase, we began our cross-border operations to Azerbaijan market in the first quarter of 2022 which we aim to gradually scale.
Customer Experience
Based on the results of the market research conducted by FutureBright (a local research company) for Hepsiburada, we continued our Net Promoter Score (“NPS”) leadership in the Turkish e-commerce market with an NPS of 72 in Q1 2022. Our services, which provide “peace of mind” experience to our customers during their shopping journey, were instrumental in customer appreciation and trust.
Among those services, we provide frictionless return, next-day delivery, and convenient two-men handling cargo service, all enabled by our well-established logistics and technology infrastructure. HepsiJet delivered 82% of the orders from retail (1P) on the next day in the first quarter, continuing the performance of the previous quarter. Having reached a coverage of all 81 cities in Turkey, HepsiJet XL, our two-man cargo handling service, has continued to provide a high quality and reliable service for the delivery of oversized products, evidenced by approximately 99% customer satisfaction score in the first quarter of 2021 according to our internal reporting.
Hepsipay
Hepsiburada offers its customers innovative payment solutions and services such as one-click check-out, multi-credit card payment, payment in installments, instant customer loans, store credit such as buy-now-pay-later and charge to billing ability with a telco partner.
Hepsiburada’s wallet solution, Hepsipay Wallet has continued its rapid penetration within the platform, marking 7.1 million Hepsipay Wallet customers (represents those users who have opened their wallet account by giving required consent to Hepsipay) as at the end of Q1 2022. In the first quarter of 2022, around 40% of total GMV passed through Hepsipay Wallet, compared to 37% in the fourth quarter of 2021.
In February 2022, we launched a new store credit solution called “Buy Now Pay Later”(“BNPL”), marking a first in the Turkish e-commerce. Our customers enjoy the opportunity to pay in up to six monthly installments for their purchases at our Hepsiburada store (1P). BNPL limits are defined based on the financial history of consumers based on their record at the Credit Bureau of Turkey and shopping track record at Hepsiburada. The early demand for this new store credit solution has been encouraging. While we plan to scale our offering cautiously and roll-out new features gradually in the remainder of 2022, we remain focused on monitoring the credit risk behavior including early delinquency and default rates.
HepsiExpress
HepsiExpress, our on-demand delivery service for grocery, water and flower verticals, remains focused on enhancing the end-to end customer experience and excelling in the customer journey by maintaining our perfect order ratio performance (measured as the number of orders delivered on time, in full and with no return request to the total number of orders of HepsiExpress) which was around 74% in the first quarter of 2022. Starting in early 2022, HepsiExpress has been in the process of optimizing its service models in groceries where its partners execute most of the picking and delivery operations. This has resulted in minimal dependency on our own delivery resources, helping us reach a more cost-effective service model, evolving from delivering through our own resources into acting mainly as an intermediary. We will continue to seek to better fulfill our value proposition of verticals and constantly explore different service models with the target of achieving more sustainable business model in the long term.
ESG Actions (post Q1 2022)
Hepsiburada became a member of the United Nations Global Compact (“UNGC”) in January 2022. By aligning to the Global Compact, we aim to improve our corporate sustainability efforts on a global scale. By becoming a signatory, we have committed to adopting and aligning the Company’s strategy and operations to UNGC principles which outline the basic responsibilities of the global business community.
As part of our efforts in relation to key UN Sustainable Development Goals related to our impact areas, namely Quality Education, Gender Equality, Reduced Inequalities and Partnership for Goals, we continued corporate social responsibility programs in cooperation with Turkey’s leading NGOs focusing on children and youth, women, and animal welfare. Within this context, in addition to our “Technology Empowerment for Women Entrepreneurs” program, we launched a new initiative addressing the basic needs of children with toys, books or stationery etc. with participating merchants and employees.
On the governance front, on May 20, 2022, we announced the appointment of two new independent board members to our Board of Directors, replacing two non-independent board members through a Form 6-K furnished with the SEC. Neither resignations were the result of any disagreement with Hepsiburada. These appointments will be submitted to the approval of Hepsiburada’s shareholders at our upcoming Annual General Assembly, scheduled on June 24, 2022, as required by the Turkish Commercial Code. We trust that strengthening our board composition with four independent members out of nine is a major achievement in our efforts for good governance.
Hepsiburada Financial Review
Further to the completion of Doruk Finansman A.Ş. acquisition (“Doruk Finansman”) by Hepsi Finansal Danışmanlık A.Ş. on February 28, 2022, we accounted for this acquisition by using the purchase method in the scope of IFRS 3 “Business combinations”. The consideration transferred in a business combination is measured at fair value, which is calculated as the sum of the acquisition-date fair values of the assets transferred by the Group, liabilities incurred by the Group to the former owners of the acquire and the equity interests issued by the Group in exchange for control of the acquire. Since the initial accounting of this acquisition within the scope of IFRS 3 standard has not been completed as of the date of preparation of consolidated financial statements, it has been accounted for with provisional amounts in the consolidated financial statement as of 31 March 2022. The initial accounting of the business combination and the necessary adjustments will be completed within 1 year from the date of merger.
In the consolidated financial statements for the three months ended March 31, 2022, Doruk Finansman’s contribution to our revenue from 28 February 2022, which is closest financial statement date to the date of acquisition, to 31 March 2022, was TRY 0.4 million and was booked under “other” line in revenue.
Revenue
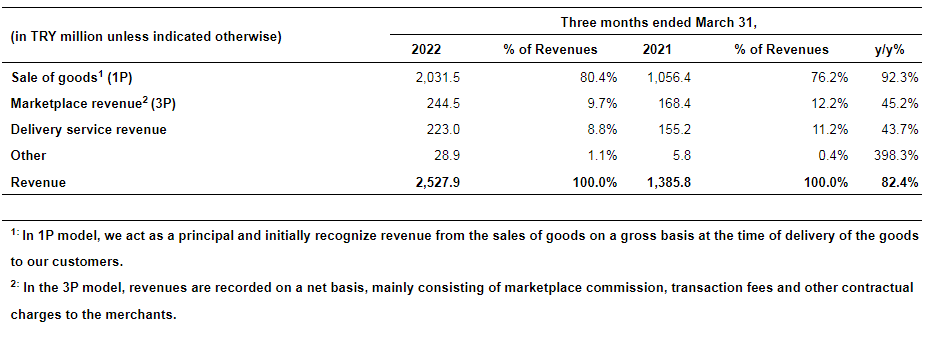
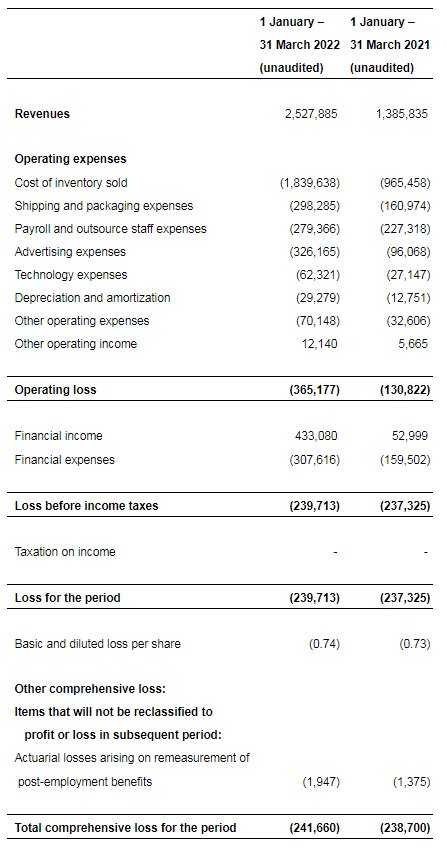
Revenue increased by 82.4% to TRY 2,527.9 million in Q1 2022 compared to the first quarter of last year. This was mainly driven by a 92.3% growth in 1P operations, comprising 80.4% of revenue, 45.2% growth in our Marketplace revenue and 43.7% increase in our delivery service revenue.
While 1P GMV grew by 109.9% compared to the same period in 2021, our 1P revenue growth was 92.3%. As part of our focus on primarily serving end-users, we continued to cancel certain B2B orders (due to these orders’ high quantity item per basket not serving our end-user strategy) which in turn impacted the conversion of 1P GMV to revenue.
In Q1 2022, while the Marketplace GMV grew by 73.3% our 3P revenue growth was 45.2%. This was mainly as a result of higher campaign costs and customer discounts for both the core business and for strategic assets (i.e. HepsiExpress and Hepsipay), which are deducted from the revenues, compared to the Q1 of 2021 under increased competition.
The 43.7% increase in delivery service revenue compared to the first quarter of last year was primarily attributable to higher delivery service revenue generated from services provided to third-parties by HepsiJet. The growth of delivery service revenue generated through Hepsiburada platform was slower than the order growth due to i) acceleration of HepsiJet’s penetration through attractive pricing to our merchant base and ii) shift in the GMV mix towards 1P, where we generate lower delivery service revenue. The increase in other revenue is mainly driven by the increase in HepsiAd (our advertising platform) and HepsiLojistik (our fulfillment services provider) revenue streams.
Gross Contribution

Our gross contribution in Q1 2022 compared to the same period of last year increased 63.7% to TRY 688.3 million whereas our gross contribution margin (as a % of GMV) declined 1.0pp to 8.3% compared to the Q1 2021. This decline in gross contribution margin in Q1 2022 was mainly due to higher customer discounts compared to Q1 2021.
Compared to Q4 2021, our gross contribution margin improved by 1.2pp in Q1 2022. This performance was mainly as a result of our focus on the path to profitability. In addition, we continued to benefit from our 1P operations as product availability and pricing flexibility in a rising inflationary environment. For our Q4 2021 results, refer to our Form 6-K furnished with the Securities and Exchange Commission (the “SEC”) on March 24, 2022 and our Form 20-F filed with the SEC on May 2, 2022, both available on SEC’s website at www.sec.gov.
Our Marketplace gross contribution reflects our Marketplace commission net-off customer discounts. Marketplace commission rate charged to merchants remained in the high single digits on average during the first quarter.
Operating Expenses:
The table below shows our operating expenses for the three months ended March 31, 2022 and 2021 in absolute terms and as a percentage of GMV:

Our net operating expenses increased by 90.8% to TRY 2,893.1 million in Q1 2022 compared to the first quarter of last year. As a percentage of GMV, our net operating expenses rose 1.2 percentage points (pp) mainly due to 1.8 pp increase in advertising expenses as a percentage of GMV, 0.7 pp rise in cost of inventory sold as a percentage of GMV offset by 1.7 pp decrease in payroll and outsourced staff expenses.
The increase in advertising expenses was mainly due to continued investment in our growth drivers and brand. In 2022, with our continued focus on expanding non-electronic and long-tail products, we used both influencer marketing and new digital channels more actively. In addition, higher unit cost of advertising compared to the same period of last year also impacted the rise in advertising expenses in the first quarter.
The increase in cost of inventory sold was mainly due to 4.2 percentage points shift in GMV to 1P compared to a year ago.
The rise in payroll and outsource staff expenses due to the increase in the number of full-time and outsourced employees with talent onboarding for core operations and for our strategic assets, along with the impact of annual salary rise and the increase in annual bonus accrual have been offset by the decrease in share based payment expenses (related to shared based payments under the incentive plan adopted prior to our initial public offering, discussed in further detail below). Accordingly, the share based payment expenses in Q1 2022 (covering the provision for equity settled part only as no share-based payment provision has been recognized for the performance target-based payments since the relevant criteria have not yet been set) was TRY 28.5 million compared to TRY 123.7 million in Q1 2021 (covering the provision for cash settled part). Excluding the effect of share based payment expenses, the payroll and outsource staff expenses as a % of GMV would have been 3.0 pp and 2.3 pp in Q1 2022 and Q1 2021, respectively.
The rise in net operating expenses was also driven by the 85.3% increase in shipping and packaging expenses, on the back of 63.2% increase in number of orders and around 38% rise in unit prices applied by our delivery partners. As the share of our own last-mile delivery service (Hepsijet) in total delivery volume increased, the growth of shipping and packaging expenses was slower than the increase in number of orders and unit prices.
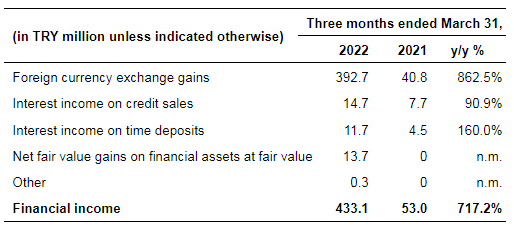
Financial Income

Our financial income increased by TRY 380.1 million to TRY 433.1 million compared to the first quarter of last year. This was mainly driven by a TRY 351.9 million increase in foreign currency exchange gains from our U.S. dollar denominated bank deposits and financial investments due to the 88.9% appreciation of the U.S. dollar against the Turkish Lira as compared to Q1 2021.
Financial Expenses
Our financial expenses increased by TRY 148.1 million to TRY 307.6 million compared to the first quarter of last year, primarily attributable to a TRY 84.1 million increase in foreign currency exchange losses from our U.S dollar denominated trade payables due to the 88.9% appreciation of the U.S. dollar against the Turkish Lira as compared to Q1 2021. The increase in our financial expenses was also due to a TRY 49.4 million increase in commission expenses related to early collection of credit card receivables due to the rise in annual effective interest rates as well as the increase in our GMV which are partially offset by our decision to increase the minimum threshold for installment level leading to higher volume of sales with no installments.
Net Loss for the Period
Net loss in Q1 2022 was TRY 239.7 million compared to net loss in Q1 2021 of TRY 237.3 million. The TRY 2.4 million increase was a result of the factors mentioned above, which also includes TRY 267.8 million net foreign exchange gains from our U.S. dollar denominated bank deposits and financial investments against fx-denominated trade payables.
EBITDA
EBITDA was negative TRY 302.9 million, compared to negative TRY 103.7 million in Q1 2021. This corresponds to a 1.3pp decline in EBITDA as a percentage of GMV in Q1 2022 compared to the same period last year. This decline was driven by 1.0pp decline in gross contribution margin, 1.8pp rise in advertising expenses as a percentage of GMV and 0.2pp increase in other operating expenses as a percentage of GMV offset by 1.7pp decline in payroll and outsource staff expenses items as a percentage of GMV.
Compared to Q4 2021, our EBITDA margin improved by 4.4 pp in Q1 2022. This improvement was driven by 1.2pp improvement in gross contribution margin, 3.1pp decline in advertising expenses as a percentage of GMV, 0.9pp improvement in other operating expense items as a percentage of GMV offset by 0.6pp rise in payroll and outsource staff expenses and 0.2pp rise in shipping and technology expenses as a percentage of GMV. The decline in customer discounts and advertising expenses from Q4 2021 to Q1 2021 is also partially due to the seasonality with the fourth quarter is being a high shopping season.
Capital Expenditures
Capex was TRY 119.4 million in Q1 2022 compared to TRY 36.3 million in the same period in 2021. Over 60% of total capex consists of the costs of employees who are employed for the development of website and mobile platforms for both core and strategic assets and whose costs are capitalized as per IFRS. Remaining capex mainly consisted of purchase of property and equipment and software and rights.
Net Working Capital
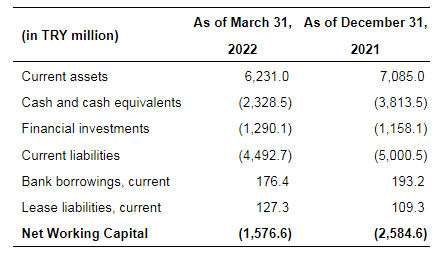
Net working capital decreased to negative TRY 1,576.6 million as of March 31, 2022 from negative TRY 2,584.6 million as of December 31, 2021. TRY 1,008.0 million decrease in negative net working capital was mainly driven by TRY 544.4 million decrease in trade payables and payables to merchants, TRY 298.7 million increase in inventories and TRY 116.8 million increase in trade receivables. The decrease in trade payables and payables to merchants was mainly due to higher volume of inventory procurements and increased service payables such as advertising, shipping and other operational expenses in Q4 2021 and which are paid in Q1 2022. We continued our inventory purchases in Q1 2022 for 1P operations with relatively shorter payment terms to ensure product availability and pricing flexibility in a rising inflationary environment. The increase in trade receivables is mainly due to increase in credit card receivables balance as a result of higher GMV generated during March 2022 compared to December 2021.
Cash Flow From Operating Activities
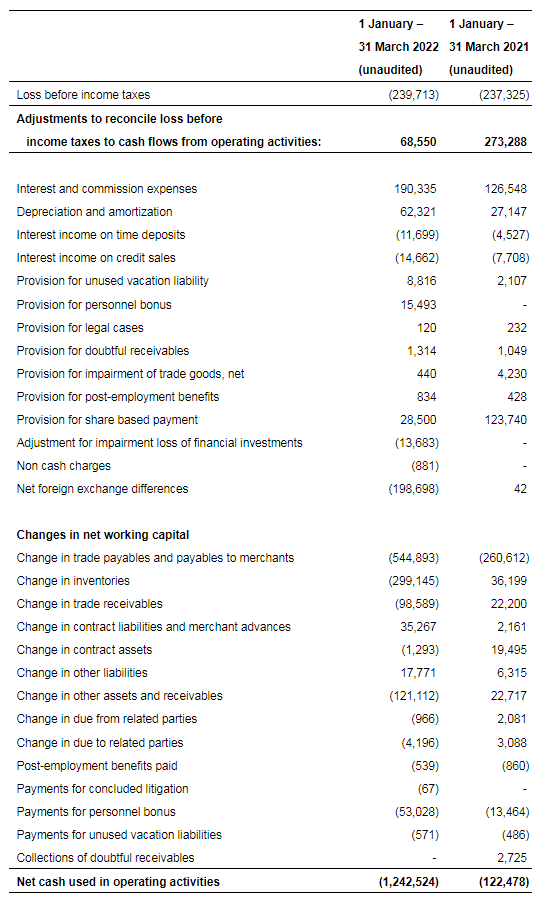
Our net cash used in operating activities for Q1 2022 comprises of TRY 239.7 million net loss (Q1 2021: net loss of TRY 237.3 million), negative TRY 1,071.4 million change in net working capital (Q1 2021: negative TRY 158.4 million) and TRY 68.5 million change in other (comprising of non-cash items such as provisions and depreciation expenses) (Q1 2021: TRY 273.3 million). Net cash provided by operating activities decreased by TRY 1,120.0 million, reaching negative TRY 1,242.5 million in Q1 2022 as compared to Q1 2021.
The decrease in our net cash provided by operating activities is mainly a result of TRY 335.3 million increase in change in inventories, TRY 284.3 million increase in trade payables and payables to merchants, TRY 143.8 million increase in other assets and TRY 120.8 million increase in change in trade receivables. Furthermore, the increase in net cash used in operating activities was also supported by a negative TRY 198.7 million increase in net foreign exchange differences for the period.
Free Cash Flow
Our free cash flow was negative TRY 1,361.9 million in Q1 2022 from negative TRY 158.8 million in Q1 2021. TRY 1,203.1 million decrease in free cash flow was mainly driven by the decrease in cash flow used in operating activities and rise in our capex, as further detailed above.
Total Cash and Financial Investments
Total cash and cash equivalents as of March 31, 2022 decreased to TRY 2,328.5 million from TRY 3,813.5 million as of December 31, 2021. The decrease is mainly due to inventory payments for both the purchases in December and during the quarter. Around 99% of our cash is in U.S. dollar (equivalent to USD 151.0 million) as of March 31, 2022 (December 31, 2021: USD 281.3 million).
Total financial investments as of March 31, 2022 amounts to TRY 1,290.1 million. Our financial investments consist of a financial asset measured at fair value and consists of U.S. dollar and Turkish Lira based mutual funds that have mainly invested in sovereign and public sector debt instruments and foreign currency linked Turkish Lira time deposits.
Bank Borrowings
Our short-term bank borrowings are utilized to facilitate supplier and merchant financing facilities as well as for our short-term liquidity if and when required in the ordinary course of our operations. As a result of the increase in our cash and cash equivalents following the IPO proceeds, our short-term borrowings decreased to TRY 176.4 million as of March 31, 2022, from TRY 193.2 million as of December 31, 2021. As of March 31, 2022, supplier and merchant financing loans corresponded to TRY 103.2 million of the short-term bank borrowings compared to TRY 92.2 million as of December 31, 2021.
In March 2022, we utilized a TRY 8.3 million long-term loan from a Turkish bank for our delivery operations (HepsiJet). The respective loan has a maturity of two years with monthly equal repayments at a total cost of funding at 23.28%.
All of our bank borrowings are denominated in Turkish Lira. As of March 31, 2022, the average annual effective interest rate for bank borrowings was 20.0% compared to 23.2% as of December 31, 2021.
Additional Information
Upcoming Adjustment to the Financial Statements to Implement IAS 29 Standard
The International Practices Task Force of the Centre for Audit Quality (“IPTF”), which monitors countries experiencing high inflation, categorized Turkey as a country with projected 36 months’ cumulative inflation rate greater than 100%. Therefore, Turkish companies reporting under IFRS, including us, will be required to apply International Accounting Standard 29 “Financial Reporting in Hyperinflationary Economies” to their financial statements for periods ending on and after June 30, 2022. Our financial statements and non-IFRS measures will be impacted as a result of the application of this standard. However, as of the date of this press release, we cannot predict the extent and magnitude of the impact that the application of IAS 29 and related adjustments will have on our financial statements, non-IFRS measures and consequently, our margins.
Conference Call Details
The Company’s management will host an analyst and investor conference call and live webcast to discuss its unaudited financial results today, Wednesday, June 1, 2022 at 16.00 Istanbul time / 14.00 London / 9.00 a.m. New York time.
The live webcast can be accessed via https://87399.themediaframe.eu/links/hepsiburada220601.html.
Telephone Participation Dial in Details:
- Turkey: + 90 212 900 3719
- UK & International: + 44 (0) 203 059 5872
- USA: + 1 516 447 5632
Participants may choose any of the above numbers to participate should they wish to ask questions.
The Company’s results presentation will be available at the Hepsiburada Investor Relations website https://investors.hepsiburada.com on June 1, 2022.
Replay
Following the call, a replay will be available on the Hepsiburada Investor Relations website https://investors.hepsiburada.com
D-MARKET Electronic Services & Trading
CONSOLIDATED BALANCE SHEETS
(Unaudited, Expressed in Thousands of Turkish Liras)


D-MARKET Electronic Services & Trading
CONSOLIDATED STATEMENTS OF COMPREHENSIVE LOSS
(Unaudited, Expressed in Thousands of Turkish Liras)
D-MARKET Electronic Services & Trading
CONSOLIDATED STATEMENTS OF CASH FLOWS
(Unaudited, Expressed in Thousands of Turkish Liras)

Presentation of Financial and Other Information
Use of Non-IFRS Financial Measures
Certain parts of this press release contain non-IFRS financial measures which are unaudited supplementary measures and are not required by, or presented in accordance with, IFRS or any other generally accepted accounting principles. Such measures are EBITDA, Free Cash Flow and Net Working Capital. We define:
- EBITDA as profit or loss for the period plus taxation on income less financial income plus financial expenses, plus depreciation and amortization;
- Free Cash Flow as net cash provided by operating activities less capital expenditures plus proceeds from sale of property and equipment and
- Net Working Capital as current assets (excluding cash, cash equivalents and financial investments) minus current liabilities (excluding current bank borrowings and current lease liabilities).
You should not consider them as: (a) an alternative to operating profit or net profit as determined in accordance with IFRS or other generally accepted accounting principles, or as measures of operating performance; (b) an alternative to cash flows from operating, investing or financing activities, as determined in accordance with IFRS or other generally accepted accounting principles, or as a measure of our ability to meet liquidity needs; or (c) an alternative to any other measures of performance under IFRS or other generally accepted accounting principles.
These measures are used by our management to monitor the underlying performance of the business and our operations. However, not all companies calculate these measures in an identical manner and, therefore, our presentation may not be comparable with similar measures used by other companies. As a result, prospective investors should not place undue reliance on this data.
This section includes for a reconciliation of certain of these non-IFRS measures to the closest IFRS measure set forth in the consolidated financial statements.
EBITDA is a supplemental non-IFRS financial measure that is not required by, or presented in accordance with, IFRS. We have included EBITDA in this press release because it is a key measure used by our management and board of directors to evaluate our operating performance, generate future operating plans and make strategic decisions regarding the allocation of capital. In particular, the exclusion of certain expenses in calculating EBITDA facilitates operating performance comparability across reporting periods by removing the effect of non-cash expenses and non-operating expense/(income). Accordingly, we believe that EBITDA provides useful information to investors in understanding and evaluating our operating results in the same manner as our management and board of directors.
Management uses EBITDA:
- as a measurement of operating performance because it assists us in comparing our operating performance on a consistent basis, as it removes the impact of non-cash and non-operating items;
- for planning purposes, including the preparation of our internal annual operating budget and financial projections; and
- to evaluate the performance and effectiveness of our strategic initiatives.
EBITDA has limitations as a financial measure, including that other companies may calculate EBITDA differently, which reduces its usefulness as a comparative measure and you should not consider it in isolation or as a substitute for profit/(loss) for the period as a profit measure or other analysis of our results as reported under IFRS.
The following table shows the reconciliation of EBITDA to net loss for the period for the periods presented.
Free Cash Flow is a supplemental non-IFRS financial measure that is not required by, or presented in accordance with, IFRS. We have included Free Cash Flow in this press release because it is an important indicator of our liquidity as it measures the amount of cash we generate/(use) and provides additional perspective on whether we have sufficient cash after funding our operations and capital expenditures. Accordingly, we believe that Free Cash Flow provides useful information to investors in understanding and evaluating our operating results in the same manner as our management and board of directors.
Free Cash Flow has limitations as a financial measure, and you should not consider it in isolation or as substitutes for net cash used in operating activities as a measure of our liquidity or other analysis of our results as reported under IFRS. There are limitations to using non-IFRS financial measures, including that other companies may calculate Free Cash Flow differently. Because of these limitations, you should consider Free Cash Flow alongside other financial performance measures, including net cash used in operating activities, capital expenditures and our other IFRS results.
The following table shows the reconciliation of Free Cash Flow to net cash used in operating activities for the periods presented.

Net Working Capital is a supplemental non-IFRS financial measure that is not required by, or presented in accordance with, IFRS. Starting from Q4 2021, we have revised the definition of Net Working Capital to include the “financial investments” balance on our balance sheet as at December 31, 2021. As we believe financial investments are cash-like item by nature, we deducted from current assets along with cash and cash equivalents.
We have included Net Working Capital in this press release because it is used to measure the short-term liquidity of a business, and can also be used to obtain a general impression of the ability of company management to utilize assets in an efficient manner. Net Working Capital is critical since it is used to keep our business operating smoothly and meet all our financial obligations in the short-term. Accordingly, we believe that Net Working Capital provides useful information to investors in understanding and evaluating how we manage our short-term liabilities.
The following table shows the reconciliation of Net Working Capital to current assets and current liabilities as of the dates indicated:
Certain Definitions
We provide a number of key operating performance indicators used by our management and often used by competitors in our industry. We define certain terms used in this press release as follows:
- GMV as gross merchandise value which refers to the total value of orders/products sold through our platform over a given period of time (including value added tax (“VAT”) without deducting returns and cancellations), including cargo income (shipping fees related to the products sold through our platform) and excluding other service revenues and transaction fees charged to our merchants;
- Marketplace GMV as total value of orders/products sold through our Marketplace over a given period of time (including VAT without deducting returns and cancellations), including cargo income (shipping fees related to the products sold through our platform) and excluding other service revenues and transaction fees charged to our merchants;
- Share of Marketplace GMV as the portion of GMV sold through our Marketplace represented as a percentage of our total GMV;
- Gross Contribution as revenues less cost of inventory sold. Gross Contribution is an indicator of our operational profitability as it reflects direct costs of products sold to our buyers;
- Gross Contribution margin as Gross Contribution represented as a percentage of GMV;
- Number of orders as the number of orders we received through our platform including returns and cancellations;
- Frequency as the average number of orders per Active Customer over a 12-month period preceding the relevant date;
- Active Merchant as merchants who sold at least one item within the 12-month period preceding the relevant date, including returns and cancellations;
- Active Customer are users (both unregistered users and members) who purchased an item within the 12-month period preceding the relevant date, including returns and cancellations;
DISCLAIMER: Due to rounding, numbers presented throughout this presentation may not add up precisely to the totals provided and percentages may not precisely reflect the absolute figures.
Tune in to Martech Cube Podcast for visionary Martech Trends, Martech News, and quick updates by business experts and leaders!